디버깅 기초를 다시 잡으려고 문서를 읽었습니다.
애플에서 제공한 Stepping through code and inspecting variables to isolate bugs 문서를 의역했고, 그 외 기본적으로 필요한 Breakpoint에 대한 정보를 작성하기 위해 Setting breakpoints to pause your running app 문서의 내용도 조금 가져왔습니다. (Breakpoint는 간단하게 정리만 했습니다.)
https://developer.apple.com/documentation/xcode/setting-breakpoints-to-pause-your-running-app
Overview
소스 코드 검사할 때 버그가 왜 생기는지 확실하게 모르겠으면 코드를 단계별로 진행해서 변수가 변경되는 것을 관찰하면 버그 발생 위치를 격리해서 원인을 찾을 수 있음. Breakpoint를 사용해 코드 실행을 정밀하게 제어할 수도 있고, 필요에 따라 호출된 함수를 단계별로 들어가거나 나가면서(into and out) 버그 발생 위치를 파악할 수도 있음.
BreakPoint
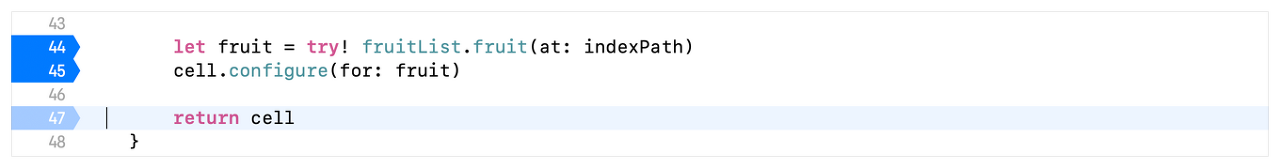
Xcode 코드 작성 부 왼쪽을 클릭해 Breakpoint 설정가능 (iOS 입문했을때 이거 잘못눌러놓고 앱 팅겨서 당황햇음..) 이렇게하면 앱이 작동하다 해당 코드를 마주했는데 일시적으로 정지한다.

왼쪽 네비게이터에서도 세부적으로 관리가 가능하다.
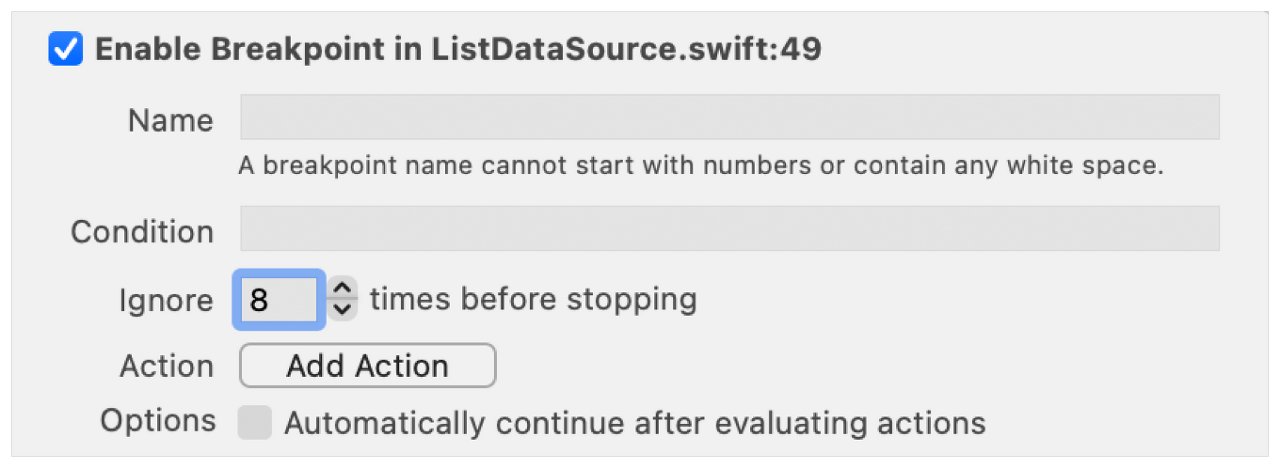
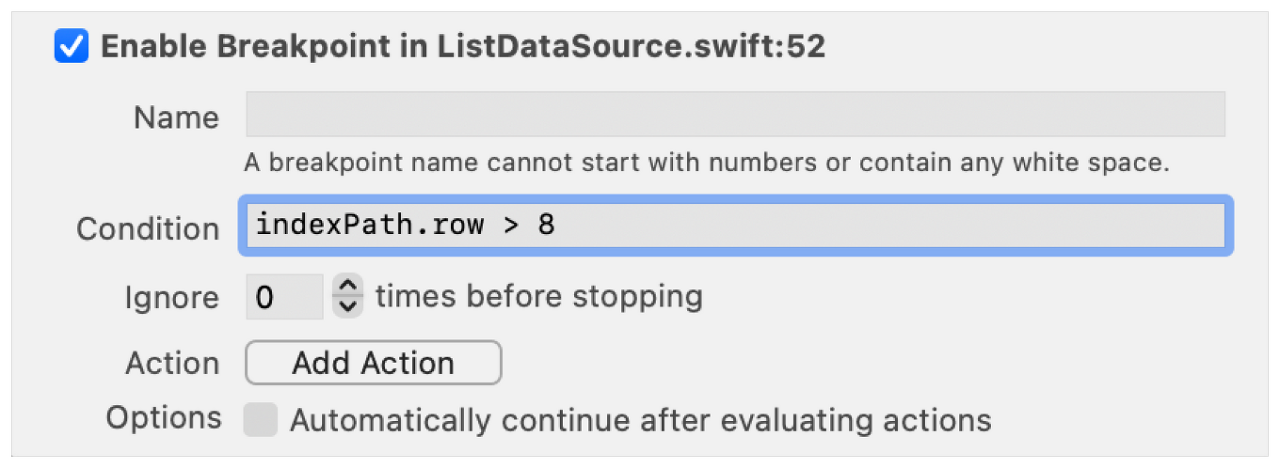
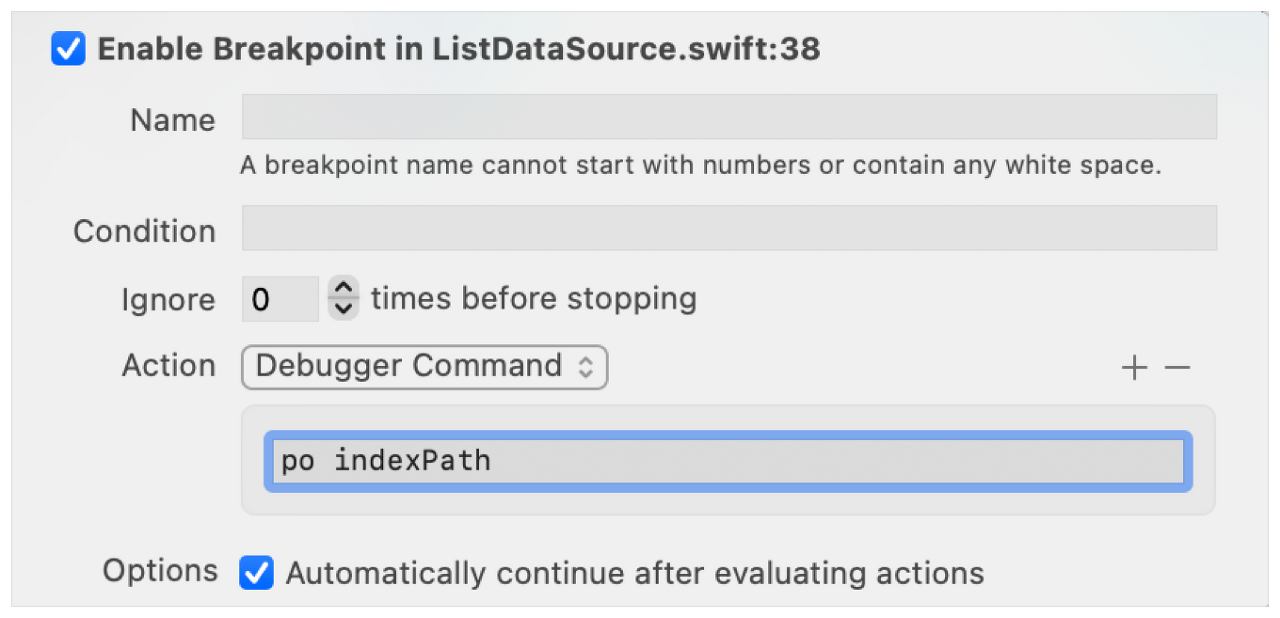
세부설정으로 무시횟수, 특정 조건, 액션 부여도 가능하다.
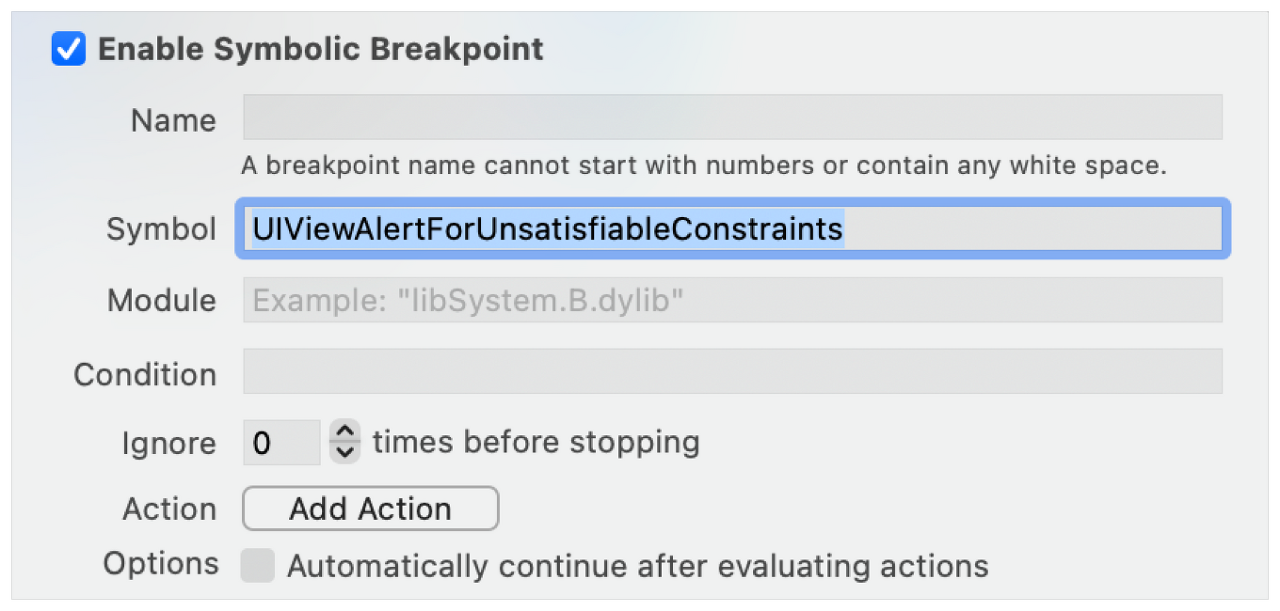
symbolic breakpoint를 만들어 소스코드에 정의되지 않은 심볼에 대한 Breakpoint도 설정할 수 있다. Breakpoint에 대해 더 자세히 알고 싶다면 Setting breakpoints to pause your running app(https://developer.apple.com/documentation/xcode/setting-breakpoints-to-pause-your-running-app)를 참고하자.
Step through code in the debugger
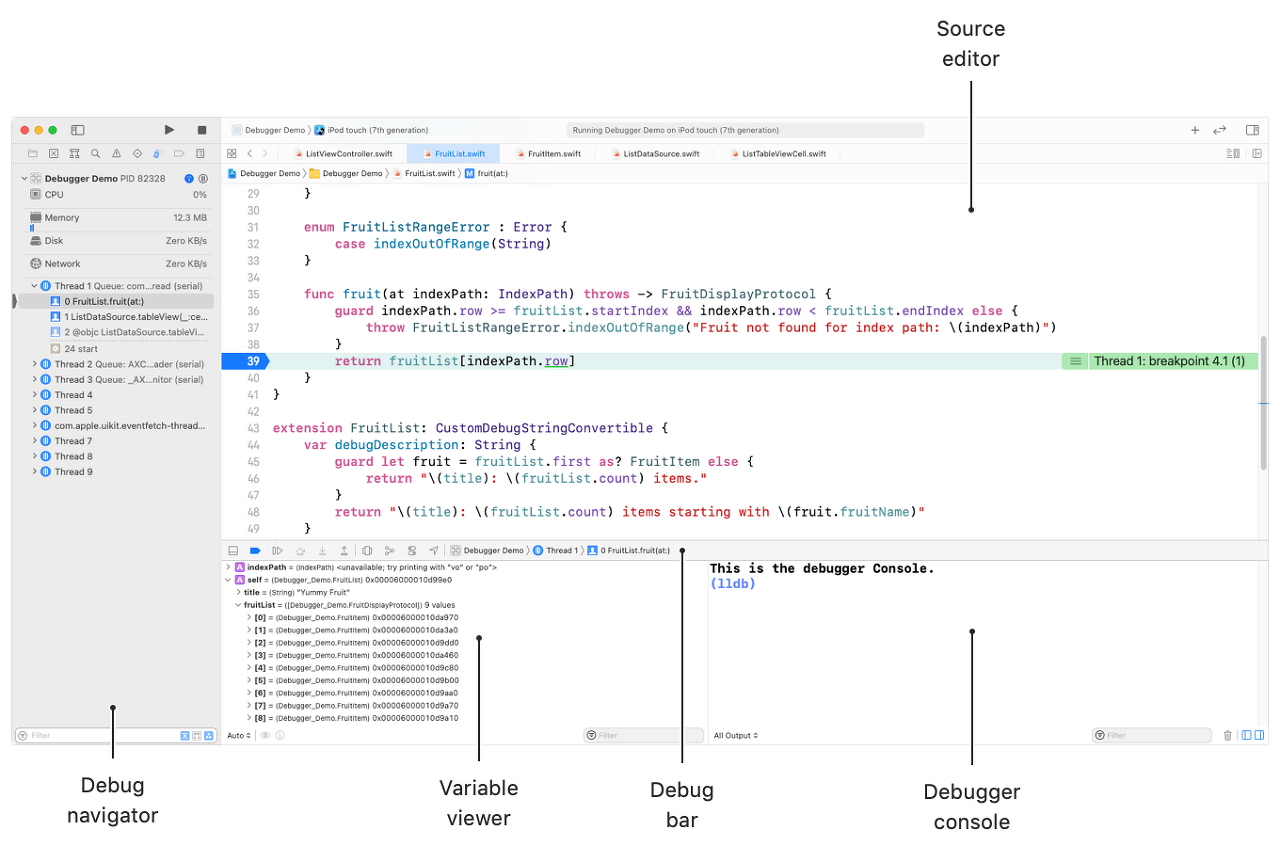
앱을 실행하면 디버거는 당신이 표기한 첫번째 Breakpoint에서 일시 중지된다. 기본적으로 Debug navigator, Source editor, Debug bar, Debug console이 보인다.
Xcode > Preferences > Behaviors > Running 에서 디버거 상태일때 Xcode에 표시될 내용을 설정할 수 있다. Debug bar의 각종 버튼을 활용하면 앱의 실행상태를 제어할 수 있다.
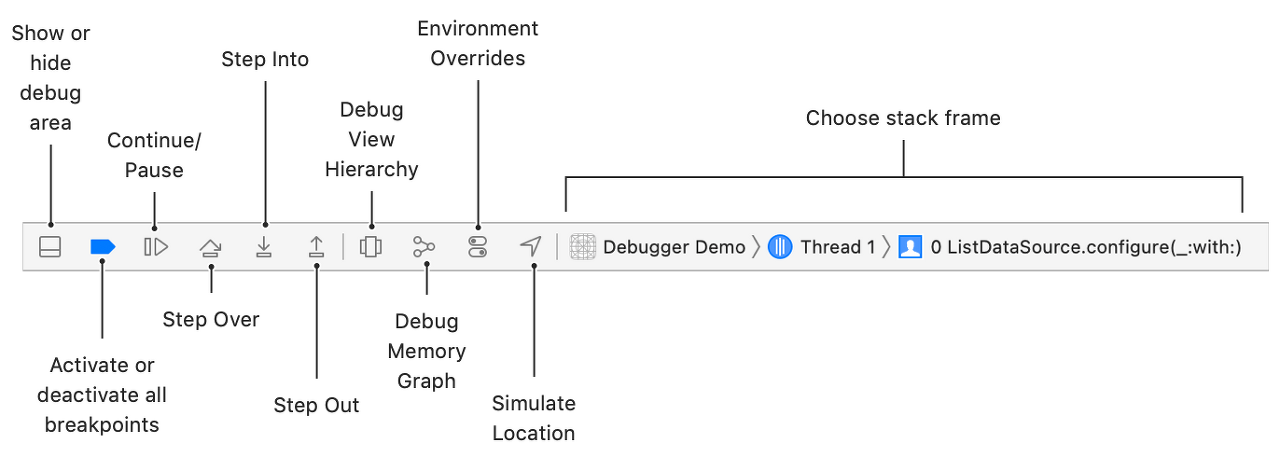
- Continue 버튼 : 앱을 재실행시킬 수 있음. 재실행된 앱은 다시 Breakpoint를 만날 때까지 정상 실행을 계속함.
- Pause 버튼 : 중단점 설정없이 앱을 일시 중지함.
- Step Over 버튼 : 현재 Breakpoint 위치에서 다음 라인으로 이동함.
- Step Into 버튼 : 현재 위치의 함수로 들어감. (함수가 아닐경우 Step Over와 동일하게 동작)
- Step out 버튼 : 들어온 함수를 빠져나감. (해당 메서드를 호출한 위치로 다시 빠져나감)
이 기능들을 활용해 단계적으로 앱을 파악해보자.
See variable values in code and the variable viewer
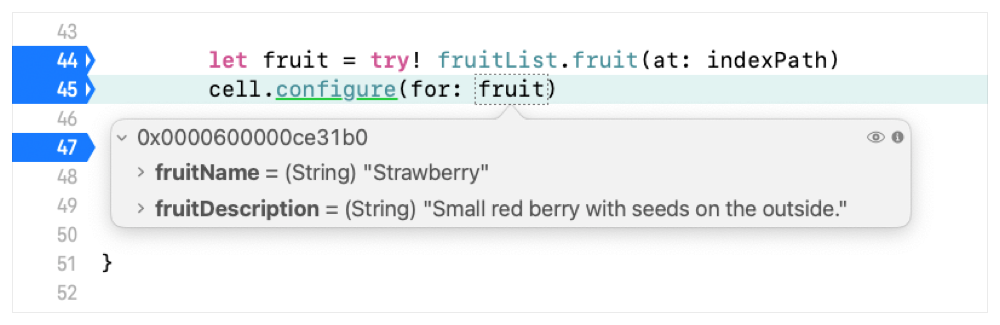
앱이 Breakpoint를 통해 중단되면 소스 코드 변수 위에 마우스를 가져다대면 해당 변수의 현재 값을 볼 수 있다. 변수가 이미지같이 텍스트로는 표현할 수 없는 타입이면 오른쪽 상단의 Quick Look 버튼을 통해 볼 수 있다. Print Description 버튼을 클릭하면 콘솔에 해당 객체에 대한 description이 print된다.
Variable viewer에는 현재 상태에서 사용가능한 변수가 나열된다. 왼쪽 아래 Scope에서 Auto, Local, All, Register, Global, Static 등을 설정해 표기될 변수 변경가능하다.
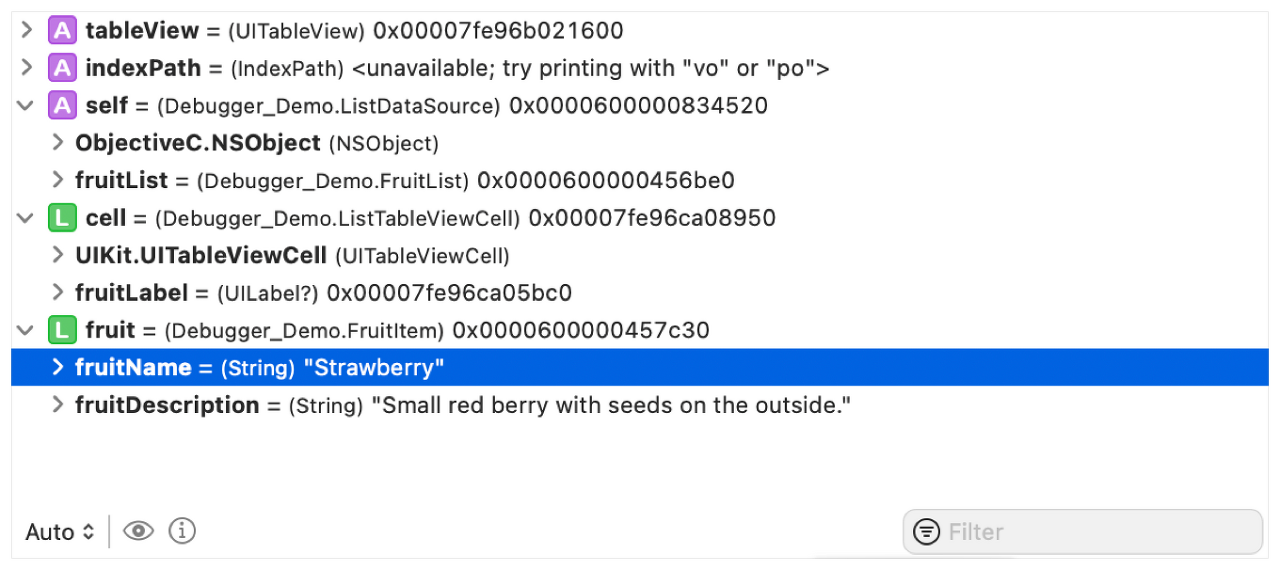
각 변수에는 타입, 값, 포인터 위치 등에 대한 정보가 함께 보여진다. 이 정보는 lldb의 커맨드인 frame variable 명령어를 기반으로 보여지는 것이다. (이와 같은 lldb 명령어에 대한 간단한 설명 아래 존재) 위에 보여지듯이 > 버튼을 클릭하면 인스턴스 변수같은 내부 정보도 탐색할 수 있다.
See the call stack and navigate related code
Breakpoint로 앱상태가 일시중지되면 Debug Navigator에서 현재 활성화된 Thread와 그에 대한 Call Stack이 표시된다. Call Stack은 현재 Breakpoint를 유발한 함수의 호출 관계를 나타낸다.
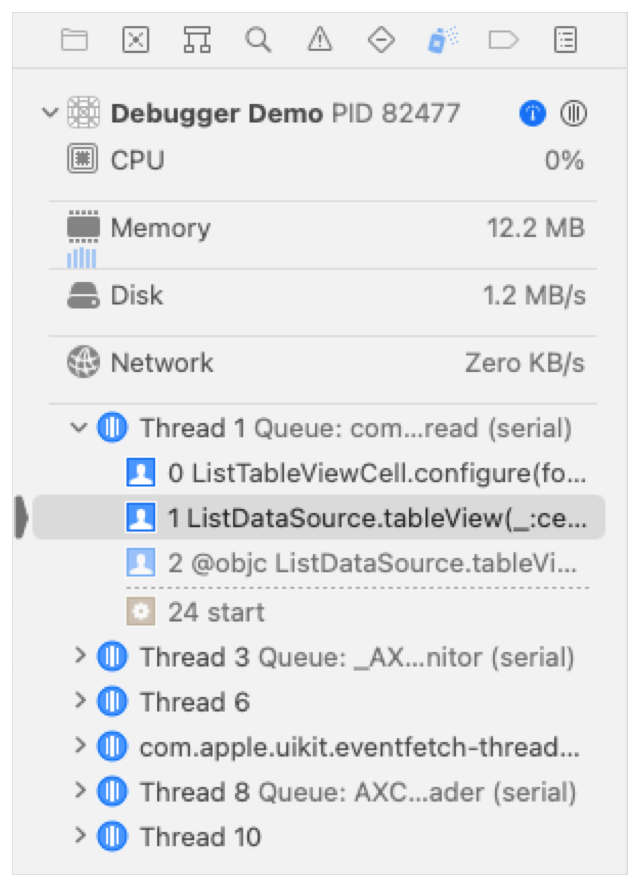
호출 함수에 버그가 있는 것으로 의심되면 Call Stack에서 특정 라인을 선택해라. 어떤 호출 함수는 인스턴스 변수를 잘못변경하거나 파라미터에 잘못 전달해 버그를 유발할 수 있다. 해당 라인과 관련된 코드를 Source editor에 표기하고 관련된 변수를 Variable viewer에 표기한다. 만약 소스 코드가 존재하지 않아 그럴 수 없다면 해당 라인의 어셈블리 코드가 표기된다.
Evaluate expressions in the console
Variable Viewer에서 보이는 것보다 더 많은 정보를 보고싶거나 디버깅 도중에 변수값을 바꿔보고 싶으면 콘솔을 활용해 디버거를 직접 활용해보자.
frame variable 아니면 단축된 alias인 v 를 통해 현재 Stack Frame에 존재하는 변수값을 인쇄함
(lldb) v self.fruitList.title
(String) self.fruitList.title = "Healthy Fruit”
(lldb) v self.listData[0]
(String) [0] = “Banana"
근데 이거는 현재 메모리에 있는 것만 반환하고 식을 계산하거나 하진 못한다.
함수 호출이나 @Published 된 변수나, computed property같은거 다 못한다는 이야기이다.
(lldb) v fruitList.fruit(at: indexPath)
error: no variable named 'fruitList' found in this frame
error: no variable named 'indexPath)' found in this frame
(lldb) v self.fruitList.calculatedFruitCount
error: "calculatedFruitCount" is not a member of "(Debugger_Demo.FruitList) self.fruitList”
식을 계산하고싶으면 expression 명령어를 쓰거나 단축된 alias p 를 사용하자.
(lldb) p self.fruitList.calculatedFruitCount
(Int) $R18 = 9
(lldb) p fruitList.fruit(at: indexPath)
(Debugger_Demo.FruitItem) $R20 = 0x00006000013dcc90 (fruitName = "Strawberry", fruitDescription = "Small red berry with seeds on the outside.”)
(lldb) expr fruit.fruitName
(String) $R14 = "Strawberry"
(lldb) p fruit.fruitName == "Peach"
(Bool) $R16 = false
(lldb) p fruit.fruitName
(String) $R2 = "Banana"
(lldb) p fruit.fruitName
(String) $R6 = "Strawberry"
(lldb) p $R2 + ", " + $R6
(String) $R8 = "Banana, Strawberry"몇몇 클래스의 경우 p 를 쓰면 메모리 포인터 위치만 표시되는 등 제한된 정보만 보여지는 경우가 있다.
이러면 expression object-description 명령어의 alias인 po 를 사용하자.
(lldb) po cell
<Debugger_Demo.ListTableViewCell: 0x7fca3450e520; baseClass = UITableViewCell; frame = (0 28; 414 43.5); clipsToBounds = YES; layer = <CALayer: 0x600001d3ed40>>
(lldb) po fruitList
Yummy Fruit: 9 items starting with Banana
p 또는 po 를 사용하면 메모리에 있는 변수 값을 변경할 수 있다.
(lldb) po fruitList.title = "Tasty Fruit"
0 elements

(lldb) po fruitList
Tasty Fruit: 9 items starting with Banana
protocol을 사용한 item을 출력하고 싶을 때, p 나 po 는 동적타입을 지원하지 않아서 에러가 난다. 그러니까 이럴 땐 v 를 쓰자.
'🍎 Apple > Xcode' 카테고리의 다른 글
| [Xcode] 시뮬레이터 다크모드 전환 단축키 (0) | 2023.10.27 |
|---|---|
| [Xcode] Instruments란? (2) | 2021.12.30 |
| [Xcode] 다크모드 Color Set 생성 (0) | 2021.08.27 |