데이터 판단
import numpy as np
import pandas as pd
import matplotlib.pyplot as plt
import seaborn as sns

df = sns.load_dataset('iris')
df
==결과==
sepal_length sepal_width petal_length petal_width species
0 5.1 3.5 1.4 0.2 setosa
1 4.9 3.0 1.4 0.2 setosa
2 4.7 3.2 1.3 0.2 setosa
3 4.6 3.1 1.5 0.2 setosa
4 5.0 3.6 1.4 0.2 setosa
.. ... ... ... ... ...
145 6.7 3.0 5.2 2.3 virginica
146 6.3 2.5 5.0 1.9 virginica
147 6.5 3.0 5.2 2.0 virginica
148 6.2 3.4 5.4 2.3 virginica
149 5.9 3.0 5.1 1.8 virginica
[150 rows x 5 columns]- seaborn 내장에서 iris 데이터셋을 불러온다.
- 예제를 위해 만들어진 데이터이기 때문에 퀄리티가 상당히 우수하다.
sns.pairplot(df, diag_kind='kde', hue='species')
plt.show()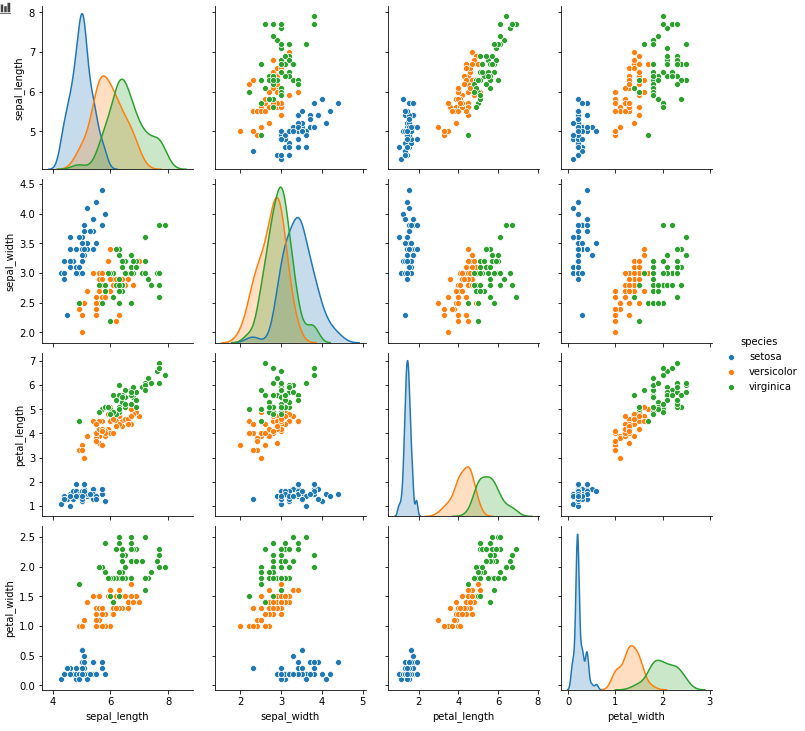
- seaborn의 pairplot 함수를 활용하면 산점도행렬을 그릴 수 있다.
- diag_kind : 대각선 원소(x축과 y축이 겹칠 경우) 그릴 그래프
- hue : 카테고리 구분 컬럼
데이터 정의
X = df.iloc[:, :4]
y = df.iloc[:, -1]- 독립변수와 종속변수를 X와 y로 나눈다.
- 우리는 sepal_length, sepal_width, petal_length, petal_width를 기반으로 species를 분류할 것이다.
학습 데이터와 테스트 데이터 나누기
from sklearn.model_selection import train_test_split

X_tratin, X_test, y_train, y_test = train_test_split(X, y, stratify=df.species, random_state = 0)
X_tratin.shape , X_test.shape , y_train.shape, y_test.shape- sklearn의 train_test_split을 사용해 학습 데이터와 테스트 데이터를 나눈다.
- stratify는 학습 데이터와 테스트 데이터에 대해 지정한 칼럼 데이터의 비율을 유지하도록 한다. 해당 코드에서는 species를 stratify로 주었으므로, 세 종류의 데이터 비율이 전체 데이터와 동일한 비율로 학습데이터와 테스트데이터에 할당된다.
- random_state 값을 주어 주어진 데이터가 랜덤하게 배분되도록 한다.
분류기 초기화 및 학습
from sklearn.neighbors import KNeighborsClassifier

model = KNeighborsClassifier(n_neighbors=1)
model.fit(X_tratin, y_train)- KNeighborsClassifier함수를 사용해 n_neighbors값이 1인 모델(분류기)를 만든다.
- 그리고 fit메소드에 학습 데이터를 넣어 학습을 진행한다.
테스트
from sklearn import metrics

pre = model.predict(X_test)
ac_score = metrics.accuracy_score(y_test, pre)
print("정답률:", ac_score)
==결과===
정답률: 0.9736842105263158- predict에 테스트 데이터를 넣어 결과값 pre를 얻는다.
- 그리고 해당 값을 테스트 데이터 정답(데이터에서 얻은)과 함께 metrics.accurancy_score 메소드에 넣어 정확도를 확인한다.
'🛠 기타 > Data & AI' 카테고리의 다른 글
| [scikit-learn 라이브러리] KNN 분류기 옵션 (0) | 2020.07.22 |
|---|---|
| TF, DF, IDF (0) | 2020.07.21 |
| [scikit-learn 라이브러리] 비만도 데이터 기반 분류 문제 (0) | 2020.07.17 |
| 선형회귀와 경사하강법(Gradient Descent) (0) | 2020.07.17 |
| 파이썬 토크나이저 - 단어 개수 세기 (0) | 2020.07.17 |