다항회귀
import numpy as np
import matplotlib.pyplot as plt
%matplotlib inline

n = 100

x = 6 * np.random.rand(n, 1) - 3
y = 0.5 * x**2 + x + 2 + np.random.rand(n, 1)

plt.scatter(x, y, s=5)
- 위와 같은 데이터는 데이터의 분포가 곡선으로 나타나기 때문에 일반적인 선형회귀로 해결할 수 없다. (비선형)
- 따라서 다항 회귀를 사용한다. 다항회귀란 위와 같이 데이터들간의 형태가 비선형 일때 데이터에 각 특성의 제곱을 추가해주어서 특성이 추가된 비선형 데이터를 선형 회귀 모델로 훈련시키는 방법이다.
기본 과정
from sklearn.preprocessing import PolynomialFeatures

poly_features = PolynomialFeatures(degree=2, include_bias=False) # 기본 다항식형태를 만들고
x_poly = poly_features.fit_transform(x)
# 새롭게 정의된 numpy 배열은 행별로 각 데이터를 다항 형태로 변형해준다.- PolynomialFeatures함수를 통해 현재 데이터를 다항식 형태로 변경한다. (각 특성의 제곱 혹은 그 이상을 추가)
- degree 옵션으로 차수를 조절한다.
- include_bias 옵션은 True로 할 경우 0차항(1)도 함께 만든다.
- 이렇게 만들어진 다항식 모델에 x를 fit transform하여 새로운 데이터를 생성한다.
x[0], x_poly[0]==결과==
(array([2.66030356]), array([2.66030356, 7.07721505]))- fit_transform을 통해 위와 같이 기존의 x를 제곱한 제곱한 항을 추가하여 반환한다.
from sklearn.linear_model import LinearRegression
# model.coef_, model.intercept_
model = LinearRegression()
model.fit(x_poly, y) # 다항회귀 모델에 그렇게 변형한 데이터와 기존 y값을 넣고 학습시킨다.- 선형회귀 모델을 만들고, 다항화한 x의 데이터와 기존의 y값을 모델에 fit시켜준다.
- 이를 통해 모델이 완성되었고 이를 활용할 수도 있다.
pipeline 응용
# 데이터 변환 과정과 머신러닝을 연결해주는 파이프라인
from sklearn.pipeline import make_pipeline

model_lr = make_pipeline(PolynomialFeatures(degree=2, include_bias=False),
                         LinearRegression())
model_lr.fit(x, y)
print(model_lr.steps[1][1].coef_)
==결과==
[('polynomialfeatures', PolynomialFeatures(degree=2, include_bias=False, interaction_only=False,
order='C')), ('linearregression', LinearRegression(copy_X=True, fit_intercept=True, n_jobs=None, normalize=False))]
[[1.00396419 0.50084752]]- make_pipeline을 통해 PolynomialFeatures와 LinearRegression의 과정이 한번으로 통합된 모델을 생성한다.
- make_pipeline으로 생성된 모델은 step에 따라 과정이 나누어진다. (steps함수도 존재하여 파이프라인에 포함된 모델의 형태를 확인할수도 있다.)
- 그렇게 생성된 모델에 x와 y를 fit시키고, 최종적으로 steps를 통해 학습된 모델의 형태를 확인할 수 있다.
# 다항회귀 그래프
xx = np.linspace(-3, 3, 100)
y_pred = model_lr.predict(xx[:, np.newaxis])
plt.plot(xx, y_pred)
plt.scatter(x, y, s=5)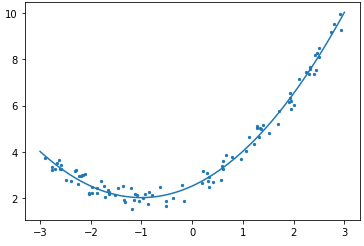
- 선형회귀 모델 결과를 그려보면, 위와 같이 곡선형태로 나타남을 알 수 있다.
'🛠 기타 > Data & AI' 카테고리의 다른 글
| [scikit-learn 라이브러리] LogisticRegression (로지스틱 회귀) (0) | 2020.07.29 |
|---|---|
| [scikit-learn 라이브러리] SGDClassifier (선형분류) (0) | 2020.07.28 |
| 워드 임베딩 - GloVe 기초활용 (0) | 2020.07.28 |
| 단층 퍼셉트론 - 이진판단 구현 확장 (0) | 2020.07.27 |
| 단층 퍼셉트론 - 이진판단 구현 (0) | 2020.07.27 |